
Finance
Financial Reporting
Every statement, always current.
Balance sheet, P&L, general ledger, trial balance and tax returns generated live from your books — drill from any figure down to the source entry.
See it in action
Every statement, generated live — and ready to drill into.
Balance sheet, P&L, cash flow, trial balance and aged balances — all built from the same posted entries, each with period comparison, forecast and a plain-English AI read built in.
Revenue
633,681
+50.5% vs prior
Operating cash
−547,920
+28.6% vs prior
Trial balance
4.22M
DR = CR · balanced
Aged > 120d
896,940
59% of receivables
Statement narrative · Nova
Across all five statements this period: revenue is up 50.5% to 633,681 while operating expenses of 1.42M push net income to −789,577 — a 20.9% improvement on the prior period. The trial balance is in equilibrium at 4,224,843 (debits = credits), confirming the books reconcile. Two items need attention before close: an unexplained cash difference of 212.88k on the cash-flow statement, and 896,940 (59%) of receivables now sitting beyond 120 days against zero doubtful-debt provision. Toggle Posted only to see the effect of the 11 draft entries in the window.
Five statements, one live dataset.
No exporting to a spreadsheet to “finalise” the numbers. Every statement recomputes from the ledger as entries post — compare periods, drill to the source entry, or just ask.
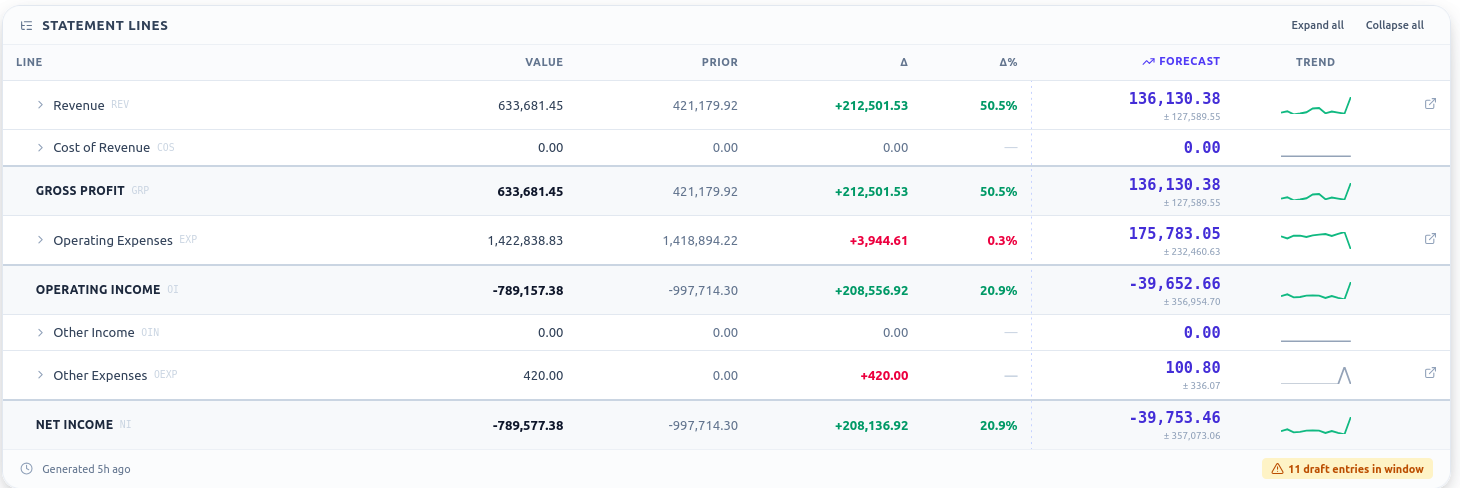
Profit & Loss
Income and expense, line by line.
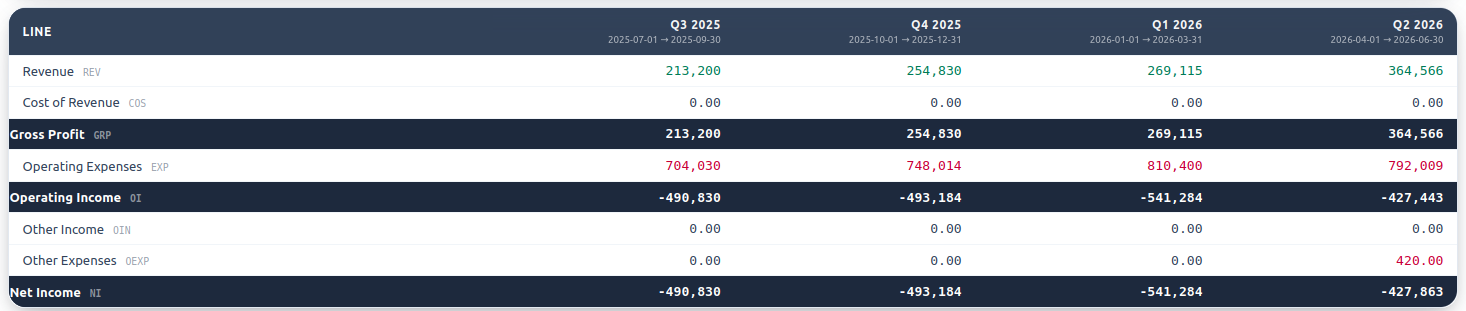
Revenue down through net income, each line carrying its prior-period value, the delta and a forward forecast — with a trend sparkline you can drill straight into the journal behind it.
- Value vs prior · Δ and Δ%
- Per-line forecast & trend
- Expand any line to its accounts
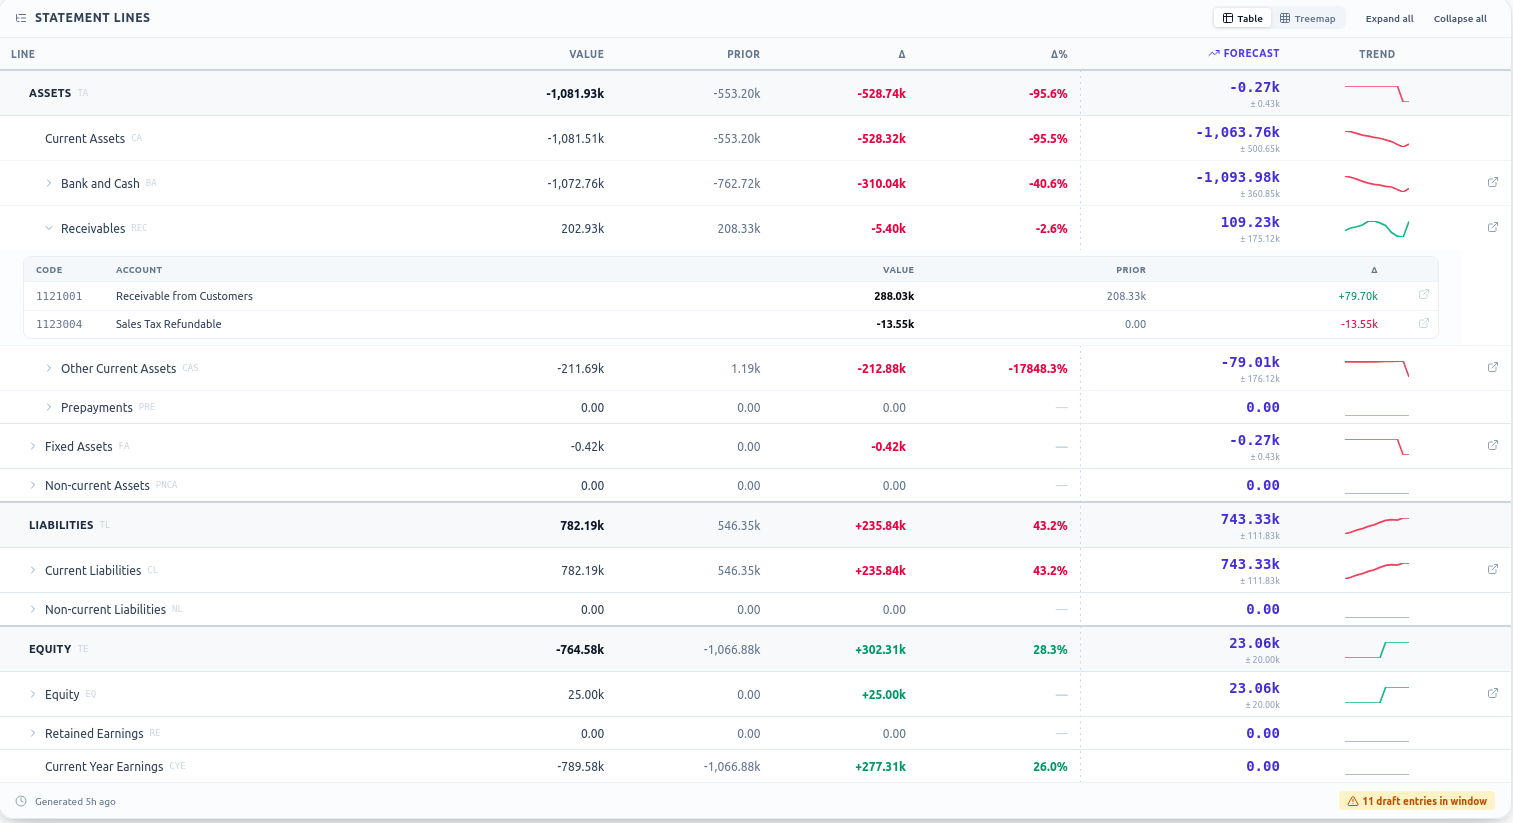
Balance Sheet
Drill from any line to the entry.
Assets, liabilities and equity as at the date — expand Receivables and the exact accounts and balances unfold underneath. Read it as a table or a treemap, with health ratios alongside.
- Assets · liabilities · equity
- Expand a line to its accounts
- Table or treemap · health ratios
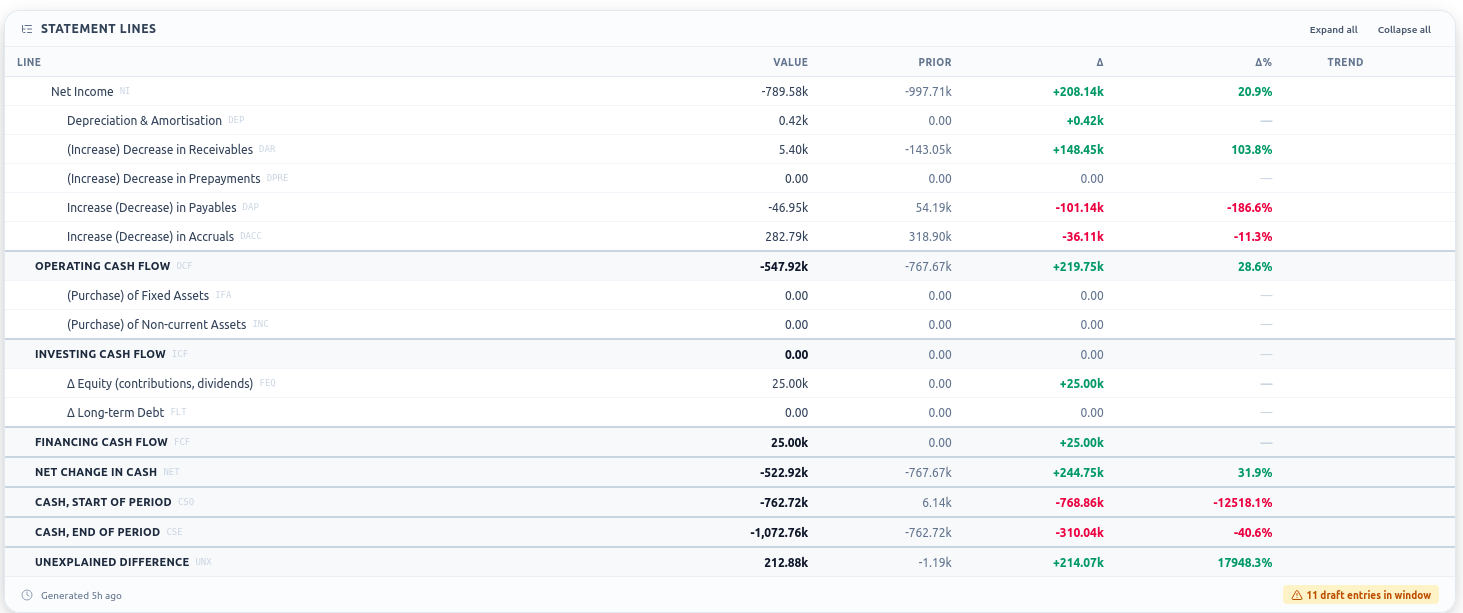
Cash Flow
Reconciled, all the way to cash.
The indirect method laid out end to end — net income adjusted through operating, investing and financing activity, landing on cash start and end, with any unexplained difference flagged for you.
- Operating · investing · financing
- Cash start → cash end
- Unexplained difference flagged
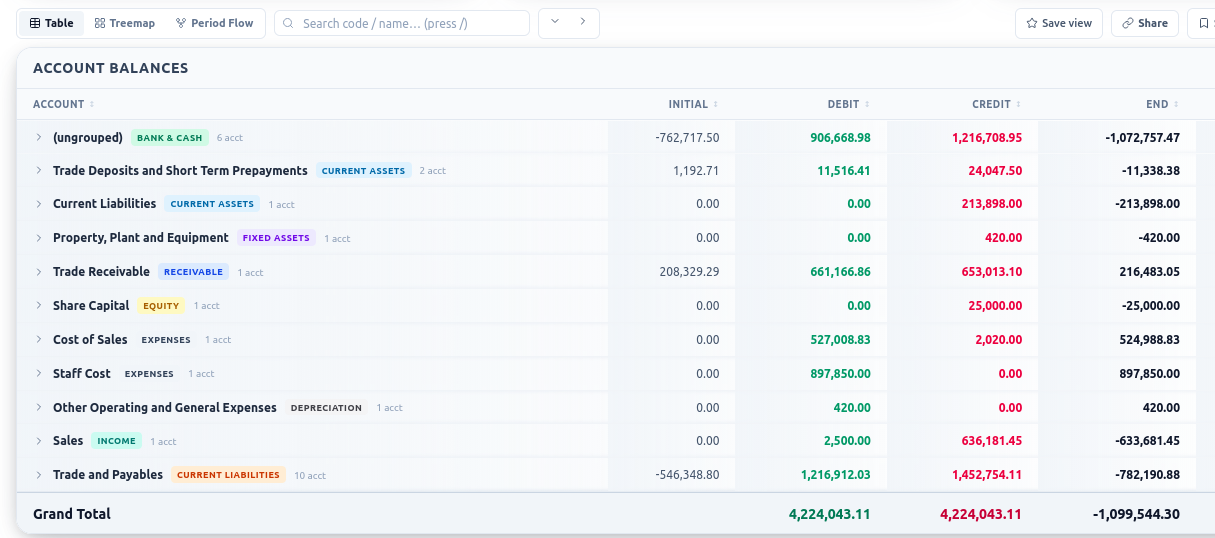
Trial Balance
Every account, always in balance.
Opening, debit, credit and closing for every account, with debits equal to credits at 4.22M — and a one-click AI summary that explains what moved and what to check before the close.
- Initial · debit · credit · closing
- DR = CR · books in equilibrium
- One-click AI summary
Aged Balances
Who owes, and how late.
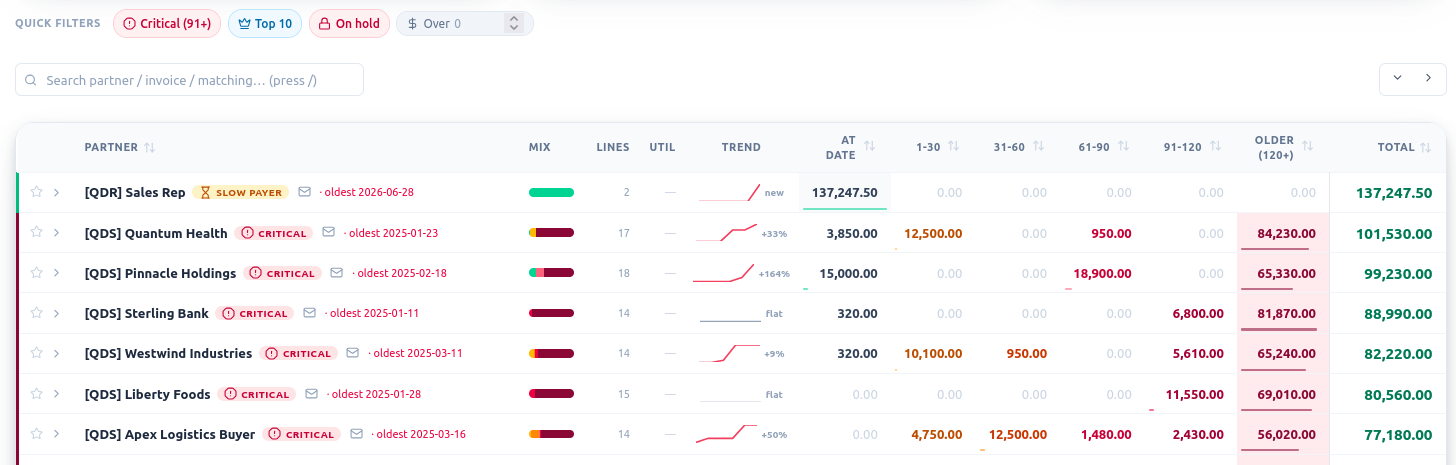
Open partner balances bucketed from 1–30 days through 120+, with slow-payer and critical flags, an expected-collections forecast and a doubtful-debt provision schedule built in.
- 1–30 … 120+ aging buckets
- Slow-payer & critical flags
- Expected collections · provision
Charts & ratios
The analytics come built in.
Every statement ships with the visuals that explain it — no separate BI tool, no rebuild, no export.
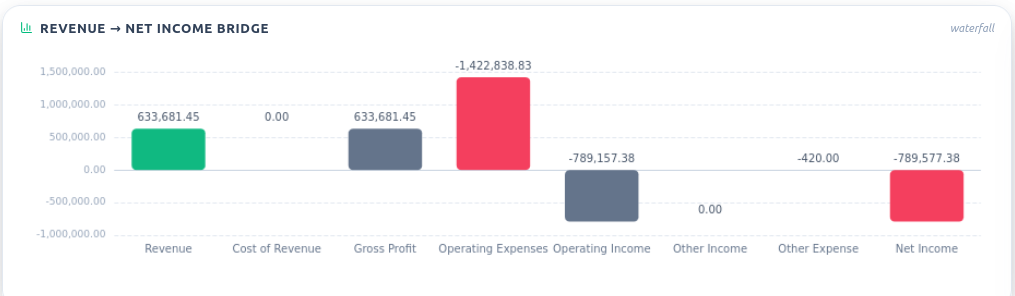
Profit & Loss
Revenue → net income bridge.
A waterfall from revenue through every cost bucket to net income — see exactly which line turned the result.
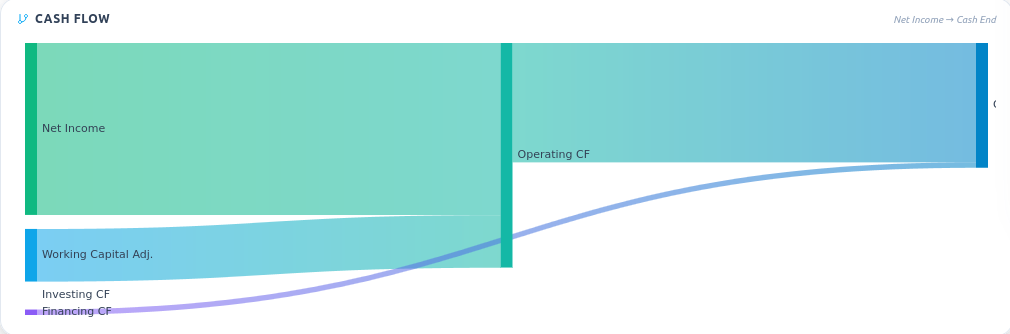
Cash Flow
Net income → cash, end to end.
Operating, investing and financing flows traced from net income to closing cash in a single diagram.

Balance Sheet
Health ratios, scored at a glance.
Current, quick, debt-to-equity, working capital and days of cash — each flagged good, watch or alert, so solvency reads itself.
Compare
Any periods, side by side.
Swap a single column for four — quarter on quarter, year on year, or against forecast — on any statement, without rebuilding a thing.
- This month · quarter · YTD · year
- Previous period · same period last year
- 4Q · 12M · 4Y · forecast
What you get
Built to run financial reporting end to end.
Core statements
Balance sheet, profit & loss, cash flow and aged partner balances, ready any time.
Drill-down everywhere
Click a number to see the journal items behind it — no exports needed.
Insight dashboards
Insight · FusionPivot, compare periods and track KPIs with variance analysis.
Editions
Choose how deep you go.
Modern views & KPIs
Everything you need to run financial reporting — modern views, lists and the core KPIs.
+ Insight (BI)
Adds Insight: Insight dashboards.
+ Nova (AI)
Adds Nova: AI assistants and predictions across your data.
Works beautifully with
Financial Reporting, and the rest of your business.
One login, one dataset, an AI concierge that sets it all up. Start free — no credit card.
Start free →