
Operations · Intelligence
Expense
Spend trend, by category and recent bills.
Where the money goes — spend trended over time, broken down by category, with the latest bills in reach.
See it in action
Every rupee out the door — categorised, trended, controlled.
Spend by category, team and month; the approval pipeline; the people trending up; and the unusual claims — all computed from real claims, with a Nova read on what to clear first.
This period
28,053
157 claims
Pending approval
26
9.0k value
Approved
33
3.7k
Refused
16
2.0k
Expense digest · Nova
157 claims totalling 28,053 this period, with 26 awaiting approval and 6 flagged as unusual. Travel & Accommodation (34%) and Uncategorised lead spend; Engineering and HR are the heaviest departments, and three employees show double-digit T&E growth. Clear the approval backlog, recategorise the uncategorised, and review the flagged large claims.
Categorised, trended and flagged — live.
No spreadsheets, no manual coding. Every claim lands categorised, rolls into the trends, and re-flags itself the moment something looks off.
Nova · AI
Ask, don't filter.
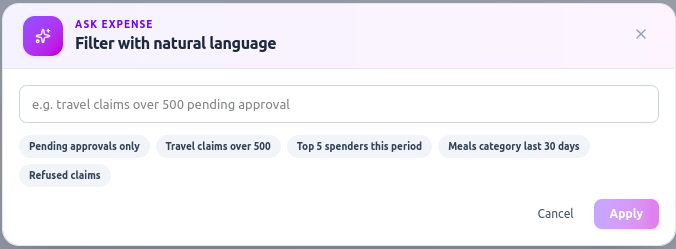
Type what you're after — "travel claims over 500 pending approval", "top 5 spenders this period" — and the board filters itself to the answer.
- “Pending approvals only”
- “Travel claims over 500”
- “Top 5 spenders” · “Meals last 30 days”
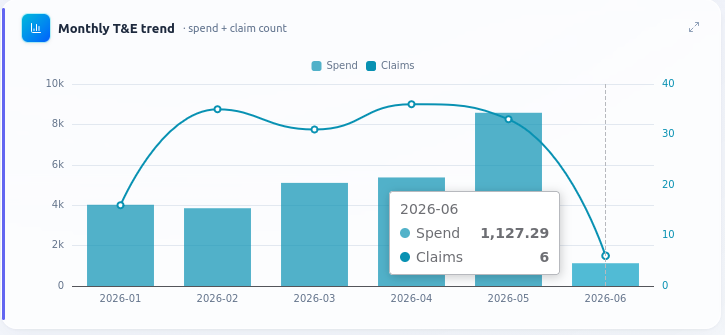
Trend
Spend and claim volume, month by month.
Travel-and-expense spend as bars against the claim-count line — so a quiet month with one big bill, or a flood of small claims, both stand out instantly.
- Spend bars + claim-count line
- Hover any month for both
- Spikes before they add up
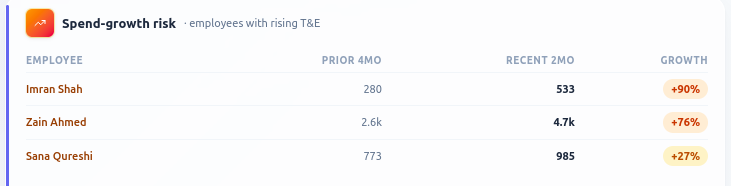
Watch
The people whose spend is climbing.
Employees whose recent T&E is running well ahead of their prior months — surfaced with the exact growth, so a creeping habit gets a conversation early, not at audit.
- Recent 2mo vs prior 4mo
- Growth % per employee
- Imran Shah +90% · Zain Ahmed +76%
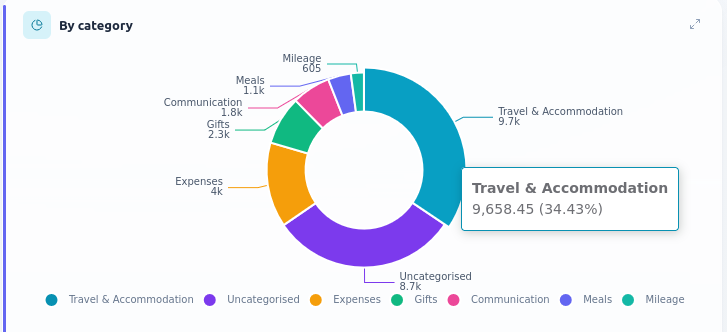
Mix
Where the money actually goes.
Every claim rolled into a category breakdown — Travel & Accommodation, Uncategorised, Meals, Mileage and more — so the categories quietly eating the budget are obvious.
- Share of spend per category
- Uncategorised flagged for cleanup
- Travel & Accommodation 34%
Trends
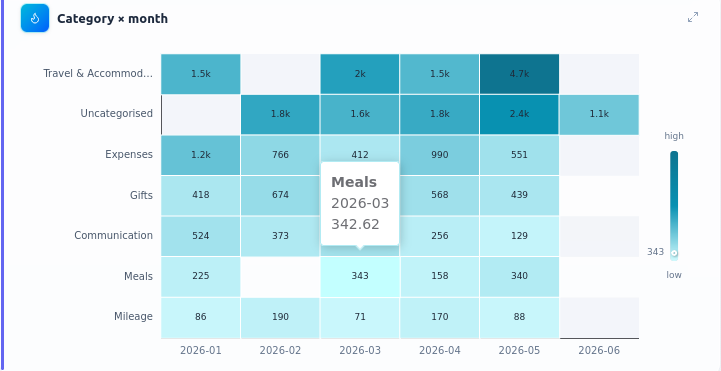
Every category, every month.
A category × month heatmap that turns a year of spend into one colour field — so a category trending up lights up long before it blows the budget.
- Categories down, months across
- Colour = spend intensity
- Hover any cell for the figure
Owners
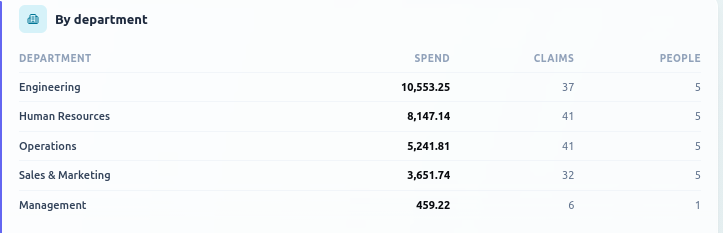
Spend by team, at a glance.
Total spend, claim count and headcount per department — so you know which team drives the bill, and whether it's many small claims or a few big ones.
- Spend · claims · people per dept
- Engineering & HR lead spend
- Cost per head, implied
Flow
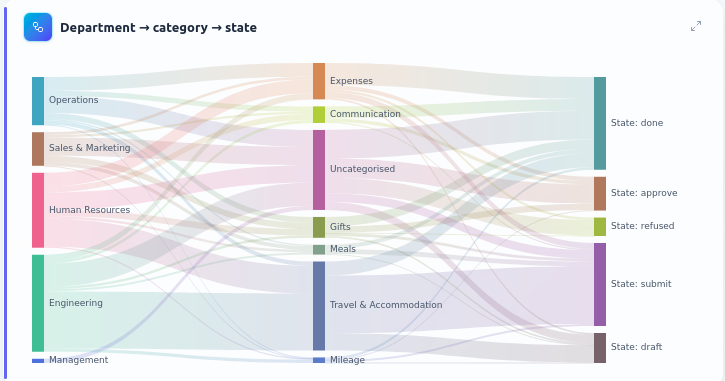
Follow every claim, end to end.
A department → category → state flow showing which teams spend on what, and where those claims sit — done, submitted, approved, refused or still in draft.
- Department → category → state
- See refusals & drafts pile up
- Bottlenecks become obvious
Pipeline
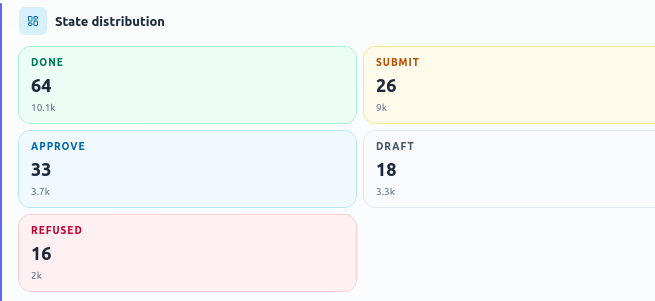
The approval pipeline, counted.
Every claim by state — done, submitted, approved, draft, refused — with the amount behind each, so the size of the approval backlog is never a guess.
- Done · Submit · Approve · Draft · Refused
- Amount behind each state
- 26 awaiting approval
Flagged
The claims worth a second look.
Unusually large claims and ones missing a description, flagged across employees and categories — so policy slips and fat-finger errors surface before they're paid.
- 6 anomalies flagged this period
- Unusually large + missing description
- Name, category & amount on each

What it surfaces
The signals, ready to read.
Spend trend
Total spend period-over-period with the spikes.
By category
The categories eating the budget, ranked.
Recent bills
The latest payables with status.
Nova · AI (Aurora)
Nova calls out the category trending above plan and the bills worth questioning.
Pairs well with
See Expense Intelligence on your data.
Sign up free and Nova builds it around your business — no setup, no credit card.
Start free →