
People & Assets · Intelligence
Budget
Planned vs actual and utilization.
Are you on plan? Budget vs actual across accounts and departments, with utilisation and the variances pulling you off track.
See it in action
Plan vs actual — variance, burn rate and the overruns, explained.
Total variance, per-budget burn rate and the accounts pulling you off plan — surfaced and explained, with a Nova FP&A brief that separates a healthy macro number from the line-level misalignment underneath it.
Variance
−25.9%
148,601 under plan
Total budget
574,489
3 budgets
Total actual
425,889
148.6k under
Overruns
4
burning > 1.5× pace
FP&A brief · Nova
Through 53% of the active period we're tracking 26% under total budget — 426k actual against 574k allocated, a favorable macro number that hides dangerous micro-level misalignment. Four accounts are flashing critical: Administrative, CampToCamp, Asustek and Lumber Inc are 101–170% consumed, with CampToCamp and Asustek burning at 5.6× and 3.6× time pace. The Annual Plan projects a 241k overrun and Q1 Operations is at-risk; large favorable swings in Luminous Technologies and Time Off are masking vendor-spend discipline. Recommend an immediate freeze and line-item audit on CampToCamp, Asustek and Administrative before the overruns cascade into Q2.
On plan, off plan and explained — live.
No month-end variance pack to assemble. Spend pace projects itself forward, overruns flag themselves, and a Nova brief explains the variance in plain English before the close.
Nova · AI
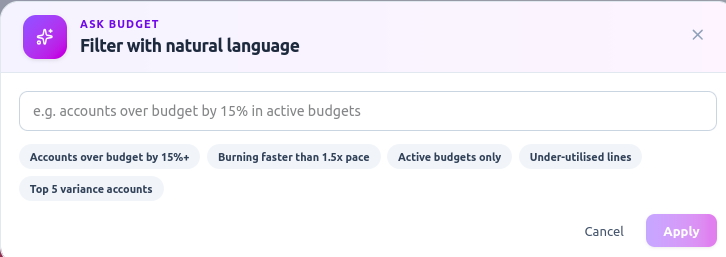
Ask the budget.
Type the question — "accounts over budget by 15%", "burning faster than 1.5x pace", "under-utilised lines" — and the board filters straight to the accounts that match.
- “Accounts over budget by 15%+”
- “Burning faster than 1.5x pace”
- “Under-utilised lines” · “Top 5 variance”
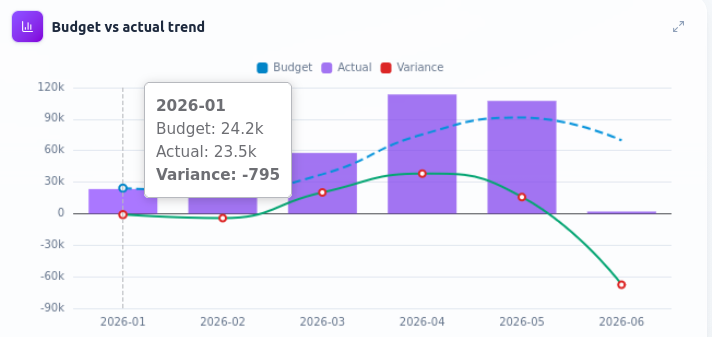
Trend
Budget vs actual, month by month.
Planned and actual side by side with the running variance traced on top — so you can see the exact month the drift started, not just the year-end total.
- Budget vs actual bars
- Running variance line
- Catch the drift early
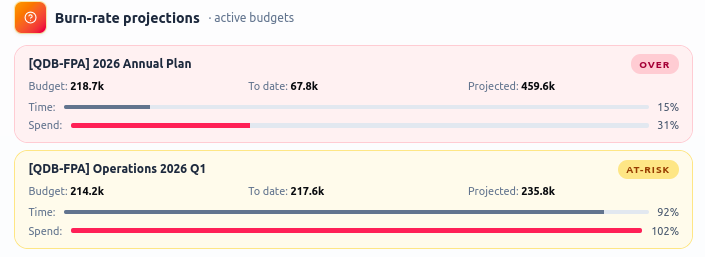
Burn rate
Will it last the period?
Time elapsed against spend consumed for every active budget, projected to period-end — so an account at 31% spend on 15% of the calendar is flagged OVER long before it lands.
- Time % vs spend %
- Projected to period-end
- OVER / AT-RISK on each budget
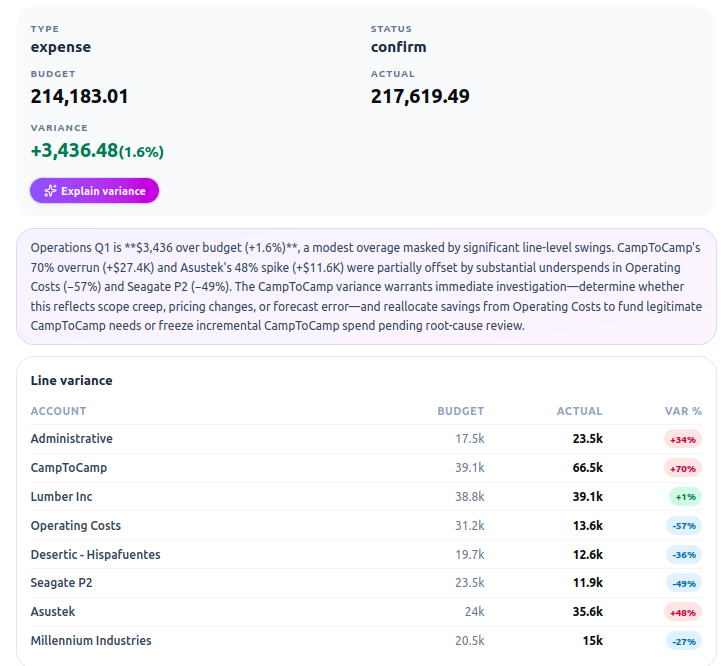
Nova · AI
Explain this variance.
One click and Nova drills into a single budget — a plain-English read of what moved, backed by the line-level table, so a modest +1.6% headline turns out to hide a +70% CampToCamp overrun offset by underspends.
- One-click “Explain variance”
- Line-level budget vs actual
- Plain-English root cause
Flagged
The accounts breaking the plan.
Full overruns and accounts burning too fast — each flagged with the percent consumed against the time elapsed, so the line-level misalignment under a healthy total surfaces by itself.
- 6 anomalies flagged this period
- Full overrun vs burning too fast
- % consumed at % time elapsed

What it surfaces
The signals, ready to read.
Plan vs actual
Every budget line against what's really been spent.
Utilization
How much of each budget is consumed, with burn rate.
Variance
The lines drifting off plan, ranked by size.
Nova · AI (Aurora)
Nova forecasts which budgets will breach and by when, with the cause.
Pairs well with
See Budget Intelligence on your data.
Sign up free and Nova builds it around your business — no setup, no credit card.
Start free →