
Executive · Intelligence
Performance
DSO, DPO, current ratio and gross margin.
The health ratios that tell you how the business is really running — collection and payment cycles, liquidity and margin, trended and benchmarked.
See it in action
Every ratio that tells you how the business is really running.
Liquidity, efficiency, profitability, leverage and growth — graded against targets, trended over time, with the ones that slipped flagged and a Nova read on what to do.
On target
7
of 17 KPIs
Watch
1
amber band
Critical
9
out of band
Cash-conversion
52d
target ≤20d
Performance digest · Nova
Of 17 KPIs tracked, 9 sit in the critical band. Liquidity is negative (current -1.38, quick -1.11) and ROA is -21.4%, even as margins read 100% on thin revenue. Priorities: restore working capital, shorten the 52-day cash-conversion cycle, and lift asset turnover toward target.
Graded, trended, and flagged — live.
No spreadsheet, no manual ratio analysis. The scorecard is computed from your real ledger and re-grades itself the moment the numbers move.
Nova · AI
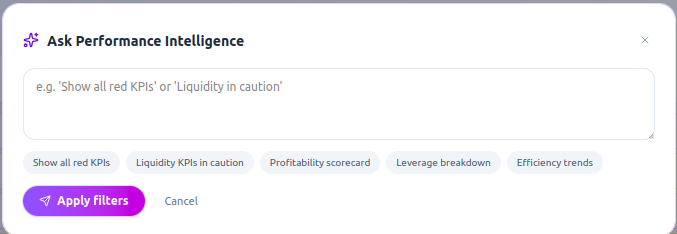
Ask which numbers are off.
Ask in plain English and the scorecard filters itself to the answer — no need to know which ratio lives where.
- “Show all red KPIs”
- “Liquidity KPIs in caution”
- “Profitability scorecard” · “Leverage breakdown”
Working capital
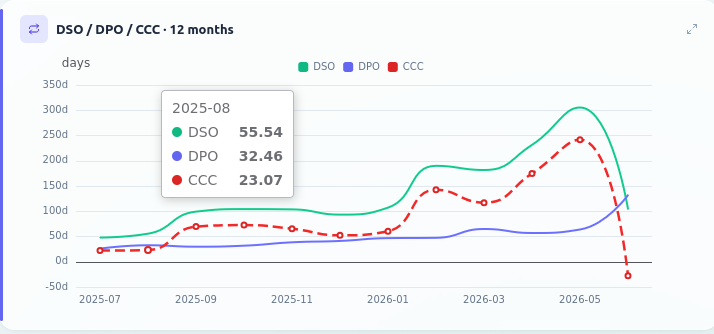
The cash-conversion cycle, month by month.
DSO, DPO and the cash-conversion cycle trended over twelve months — so you can see whether you're collecting faster than you pay, or the other way around.
- Days sales vs days payable
- CCC = how long cash is tied up
- Hover any month for exact days
The scorecard
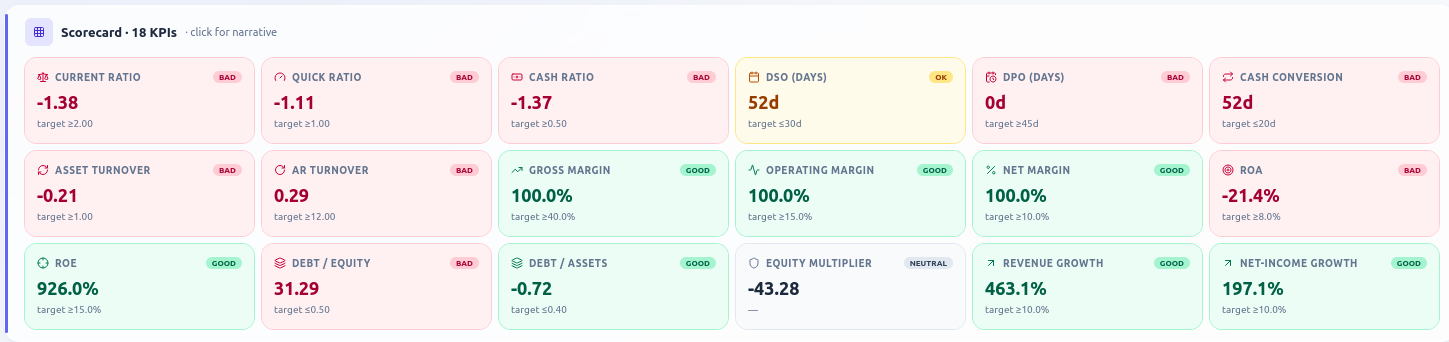
18 KPIs, each against its target.
Liquidity, efficiency, profitability, leverage and growth on one board — every ratio colour-graded good, watch or bad against the target you set, so health is readable in a glance.
- Good · Watch · Bad grading
- Target shown on every KPI
- Liquidity → growth, one screen
Flagged
The KPIs out of band.
Quelixa pulls the ratios that breached their target to the top — current, quick and cash ratios, DPO, cash conversion, asset and AR turnover, ROA — each with its current value vs the threshold.
- 8 KPIs flagged this period
- Now vs target on each
- Spans liquidity, efficiency & returns

Trends
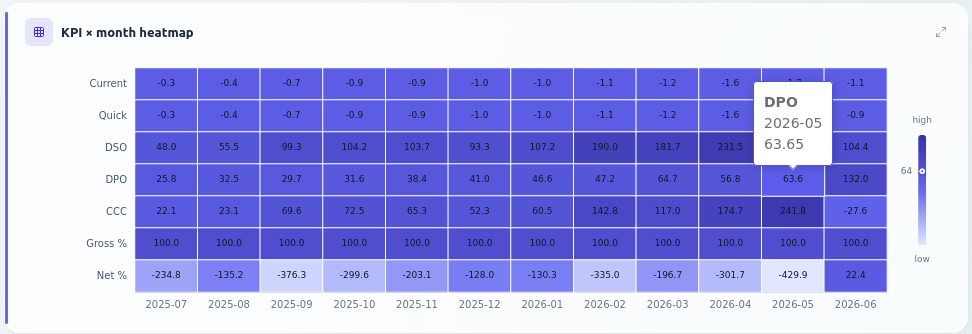
Every KPI, every month, at a glance.
A KPI × month heatmap that turns a year of ratios into a single colour field — so a metric drifting the wrong way lights up long before it hits the danger zone.
- 12 months across, KPIs down
- Colour = distance from healthy
- Hover any cell for the value
What it surfaces
The signals, ready to read.
Working-capital cycle
DSO and DPO with the cash-conversion gap between them.
Liquidity
Current ratio and quick ratio against safe thresholds.
Margin
Gross margin trend with the lines moving it.
Nova · AI (Aurora)
Nova flags the ratio drifting off-benchmark and suggests the lever to pull.
Pairs well with
See Performance Intelligence on your data.
Sign up free and Nova builds it around your business — no setup, no credit card.
Start free →