
Executive · Intelligence
Executive
A board-grade digest: revenue, margin and cash.
The one board to read before the meeting — revenue, margin and cash distilled into a board-grade digest, with the story behind the numbers written for you.
See it in action
The one board to read before the meeting.
Revenue, margin and cash distilled to a board-grade digest — alerts raised, a Nova-written brief, and every statement a click away.
Revenue (period)
633,681
+50% vs prior
Net income
-789,577
margin pressure
Working capital
-1,387,010
Tight · quick ratio -0.34
Cash position
-1,072,757
-41% vs prior
CFO digest · Nova
A net loss of $789,577 on $633,681 revenue signals acute margin pressure, while negative working capital of $1.39M and cash $1.07M below open AP point to a liquidity squeeze. Priorities: accelerate the $433,986 of AR over 90 days, clear the 11 drafts blocking the close, and rein in the OpEx that turned gross profit into a loss.
Every statement, every signal — live.
No exports, no report builder. The financials, the trends and the anomalies are computed from your real ledger and explained as you read them.
Nova · AI
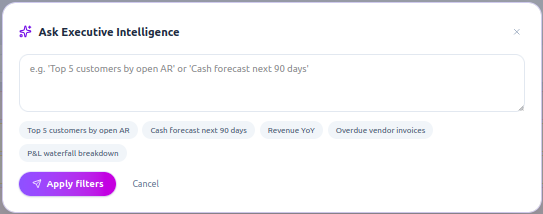
Ask the board a question.
Type what you want to know in plain English and Executive Intelligence rebuilds itself around the answer — no filters to configure, no report to request.
- “Top 5 customers by open AR”
- “Cash forecast next 90 days”
- “Revenue YoY” · “P&L waterfall breakdown”
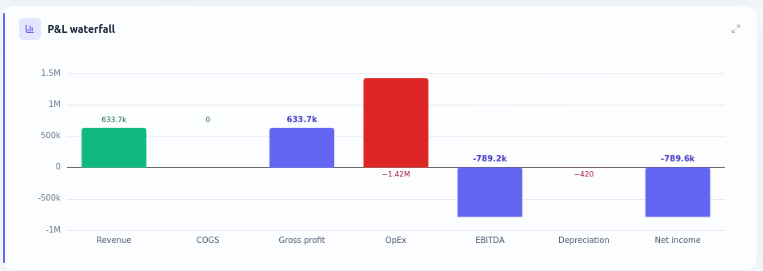
Profitability
From revenue to net income, in one read.
Watch the money fall through the P&L — revenue, COGS, gross profit, OpEx, EBITDA, net income — so where margin is made and lost is obvious at a glance.
- Every step labelled with its value
- See the OpEx that erased gross profit
- Drill any bar down to the entries
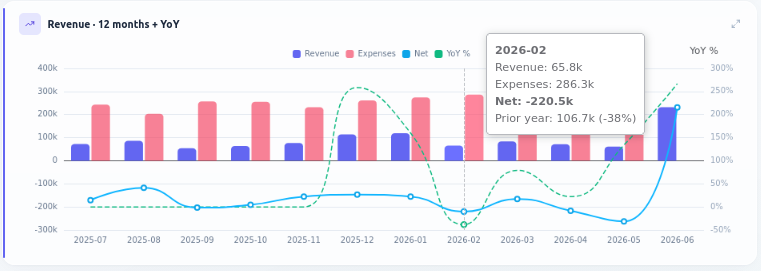
Growth
Twelve months — and how it compares.
Revenue, expenses and net side by side for the last year, with a year-over-year line that tells you whether this month actually beat the last.
- Revenue vs expenses vs net
- Year-over-year % overlay
- Prior-year delta on hover
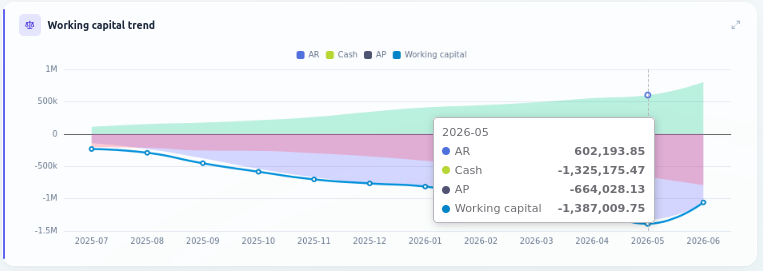
Liquidity
Where working capital is heading.
AR, cash and AP layered into one working-capital line over time — so a slow slide toward negative shows up months before it becomes a crisis.
- AR · Cash · AP, stacked
- The working-capital trajectory
- Point-in-time breakdown on hover
Cash
How fast the money moves.
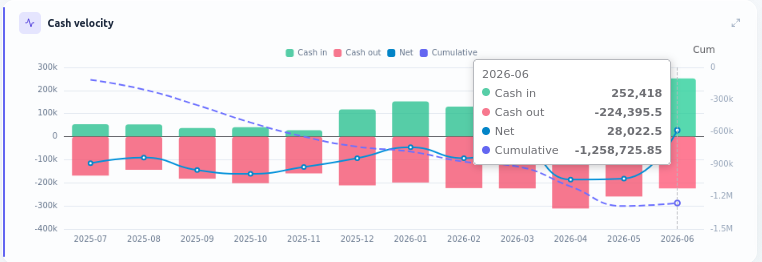
Cash in against cash out each period, the net, and the cumulative curve — the clearest read on whether the business is building cash or burning it.
- Inflow vs outflow per period
- Net + cumulative line
- The month the curve turns
Receivables & payables
What's owed to you vs what you owe.
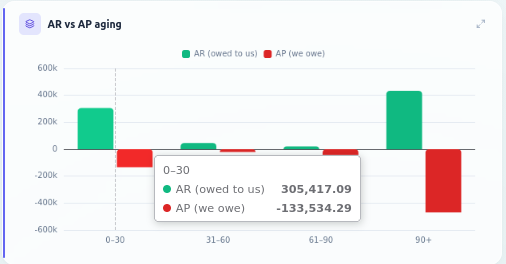
Receivables and payables bucketed 0–30 through 90+ side by side, so you can see whether collections are keeping pace with the bills.
- AR (owed to us) vs AP (we owe)
- Aging buckets 0–30 → 90+
- The 90+ exposure, called out
Position
Today's balance sheet, reconciled live.
Assets and liabilities as of today — cash, receivables, payables and more — totalled and balanced straight from the ledger, no period close required.
- Assets & liabilities, current
- Reconciled to the ledger
- As of any date you pick

Act first
Who to chase, who to pay.
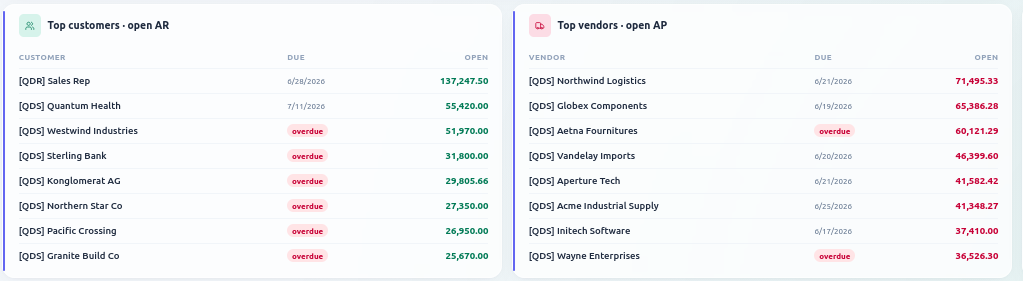
The biggest open receivables to collect and payables to settle, each flagged the moment it's overdue — so the highest-impact actions sit right in front of you.
- Top open AR with overdue flags
- Top open AP with due dates
- Ranked by what moves cash most
Flagged
The anomalies an auditor would want.
Issues surfaced across every app — material AR over 90 days, cash below open AP, drafts blocking the close, capex pending capitalisation — before they bite.
- 5 anomalies flagged this period
- Spans AR, cash, close and capex
- Each with its value and impact

What changed
What's materially different this period.
Quelixa watches for the metrics that moved hard versus the prior period and pulls them to the top — so the big swings find you, not the other way around.
- AR > 60 days +130%
- Revenue +50%
- Cash position −41%

What it surfaces
The signals, ready to read.
Headline KPIs
Revenue, gross margin and cash position at a glance.
Period digest
What moved and why, summarised for the board pack.
Trend & deltas
This period vs last, with the drivers ranked.
Nova · AI (Aurora)
Nova writes the narrative — a paragraph you can paste straight into the board pack.
Pairs well with
See Executive Intelligence on your data.
Sign up free and Nova builds it around your business — no setup, no credit card.
Start free →