
People & Assets · Intelligence
Payroll
Payroll cost, headcount and average cost.
The people cost line, understood — total payroll, headcount trend and the average cost per head, period over period.
See it in action
The people-cost line — headcount, pay and renewals in one view.
Payroll run, cost concentration, salary bands and contract expirations — surfaced and explained, with a Nova HR brief that flags the renewals you can't afford to miss.
Active staff
21
36,034 avg cost
Period payroll
756,719
gross 1.0M · 30% contrib
Drafts
0
all processed
Contracts ending
2
in 4 days
HR brief · Nova
Payroll is stable at 756,718 this period — all 21 employees processed, zero draft backlog. Engineering leads cost concentration at 203,870 across five staff, followed by Sales & Marketing at 185,884. Two critical expirations need attention: Zain Ahmed and Fatima Siddiqui (both Engineering) conclude on Jun 19 — just four days out. With Engineering the highest-cost department, losing both at once is an operational risk. Confirm renewal intent this week and execute extensions before the contracts lapse.
Processed, costed and flagged — live.
No spreadsheet reconciliation, no manual headcount roll-up. The run costs itself, cost concentration surfaces, and a Nova brief turns the period into a short list of what to act on.
Nova · AI
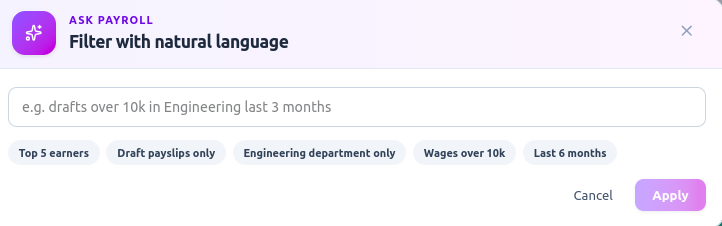
Ask payroll a question.
Type it the way you'd say it — "top 5 earners", "Engineering department only", "wages over 10k" — and the board narrows to exactly those payslips.
- “Top 5 earners”
- “Draft payslips only”
- “Engineering only” · “Wages over 10k”
Concentration
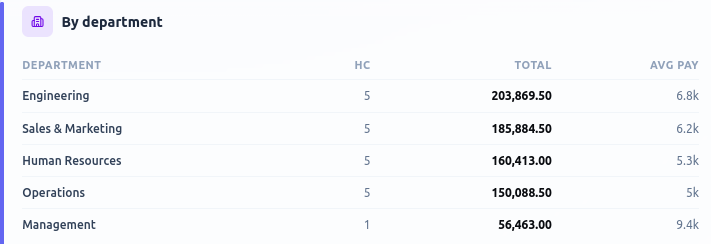
Where the cost concentrates.
Headcount, total run cost and average pay per department — so you can see at a glance that Engineering carries the highest cost line, not just the highest headcount.
- Headcount · total · average pay
- Ranked by cost, not size
- Engineering leads at 203,870
Distribution
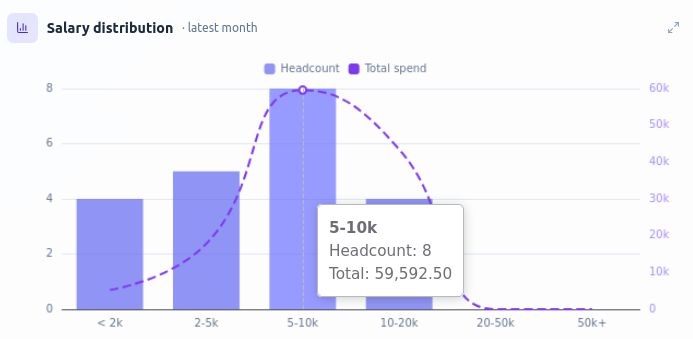
How pay is spread.
A salary-band histogram with the spend curve laid over it — where your people sit, and where the money actually goes, in a single read.
- Headcount by salary band
- Total spend curve overlaid
- 8 staff in the 5–10k band
Flow
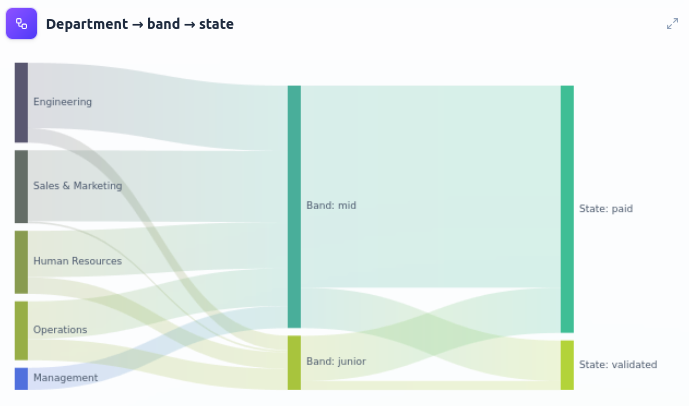
From department to paid.
A flow from department through band to payment state — follow how each team's payroll moves through mid/junior bands and lands as paid or validated.
- Department → band → state
- Width = headcount in the path
- Paid vs validated at a glance
Renewals
Contracts about to lapse.
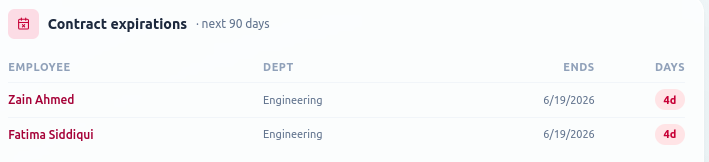
Every contract expiry in the next 90 days, with the days remaining — so two Engineering contributors ending in four days surface before they become a coverage gap.
- Expiries in the next 90 days
- Employee · department · days left
- 2 ending in 4 days
What it surfaces
The signals, ready to read.
Payroll cost
Total run cost with the period delta.
Headcount
Joiners, leavers and net headcount.
Average cost
Cost per head, trended and by team.
Nova · AI (Aurora)
Nova explains the change in payroll cost — how much is headcount vs rate.
Pairs well with
See Payroll Intelligence on your data.
Sign up free and Nova builds it around your business — no setup, no credit card.
Start free →